Difference between revisions of "Pillars Of Agile Spiderweb Retrospective"
(Created page with "__NOTOC__ ===Use:=== To talk about what abilities are important to an Agile team and how your team rates against them ===Length of time:=== It seems like these retrospectives...") |
|||
| (3 intermediate revisions by the same user not shown) | |||
| Line 11: | Line 11: | ||
===Materials:=== | ===Materials:=== | ||
Chart paper, normal paper & pens | Chart paper, normal paper & pens | ||
| − | Process: | + | |
| + | ===Process:=== | ||
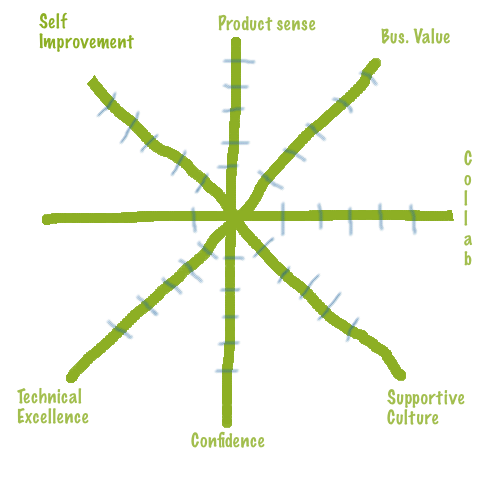
| + | [[File:Spider.png]] | ||
| + | |||
| + | The team assembles and sits. They get some paper. | ||
| + | |||
| + | I let a random person pick which pillar to start with. I describe it to them, then tell them to individually rate the whole team against it, on a one-to-five scale, five being the best, then write their rating on some paper. I tell them they can pick a range if they’re not sure which number to pick. (I think that’s what numbers like “3.5″ often mean.) | ||
| + | (In the future, I’ll have the team come to some consensus about what they mean by “one” and “five”. Some people, for example, consider “five” perfection and thus unattainable.) | ||
| + | |||
| + | When they’re ready, they hand the paper to me. While that does make it less obvious which person wrote which number, that’s a minor motivation. I do it more because it gives each person control over how long to think. | ||
| + | |||
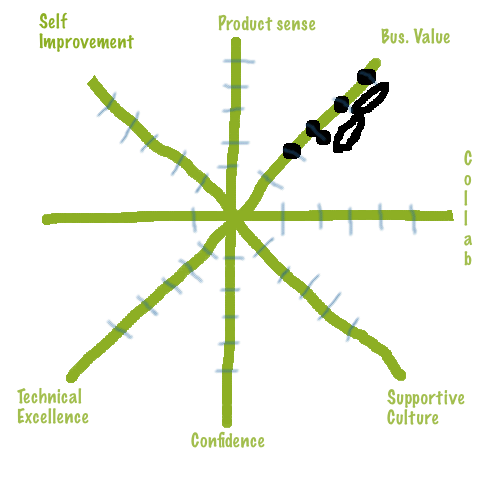
| + | Then I plot the values on the spider chart, like this: | ||
| + | |||
| + | [[File:Spider-1.png]] | ||
| + | |||
| + | Then I invite the team to discuss whatever the spread or values bring to mind. If I see something no one mentions, I bring it up, but the discussion is really in their hands. Their talk may lead to action items, but I don’t force it. | ||
| + | After the discussion of one pillar dies down, I have someone pick the next one. (I think that each time we soon just started going clockwise or anti-clockwise.) | ||
| + | |||
| + | Source: | ||
| + | Brian Marick [http://www.exampler.com/blog/2009/06/12/pillar-spiderweb-retrospectives/ 1] | ||
Latest revision as of 08:38, 25 February 2013
Use:
To talk about what abilities are important to an Agile team and how your team rates against them
Length of time:
It seems like these retrospectives want to be about an hour long.
Short Description:
a retrospective in which teams rated their abilities in each of the categories, displayed the different ratings on a spider graph, and then discussed the result.
Materials:
Chart paper, normal paper & pens
Process:
The team assembles and sits. They get some paper.
I let a random person pick which pillar to start with. I describe it to them, then tell them to individually rate the whole team against it, on a one-to-five scale, five being the best, then write their rating on some paper. I tell them they can pick a range if they’re not sure which number to pick. (I think that’s what numbers like “3.5″ often mean.) (In the future, I’ll have the team come to some consensus about what they mean by “one” and “five”. Some people, for example, consider “five” perfection and thus unattainable.)
When they’re ready, they hand the paper to me. While that does make it less obvious which person wrote which number, that’s a minor motivation. I do it more because it gives each person control over how long to think.
Then I plot the values on the spider chart, like this:
Then I invite the team to discuss whatever the spread or values bring to mind. If I see something no one mentions, I bring it up, but the discussion is really in their hands. Their talk may lead to action items, but I don’t force it. After the discussion of one pillar dies down, I have someone pick the next one. (I think that each time we soon just started going clockwise or anti-clockwise.)
Source: Brian Marick 1

